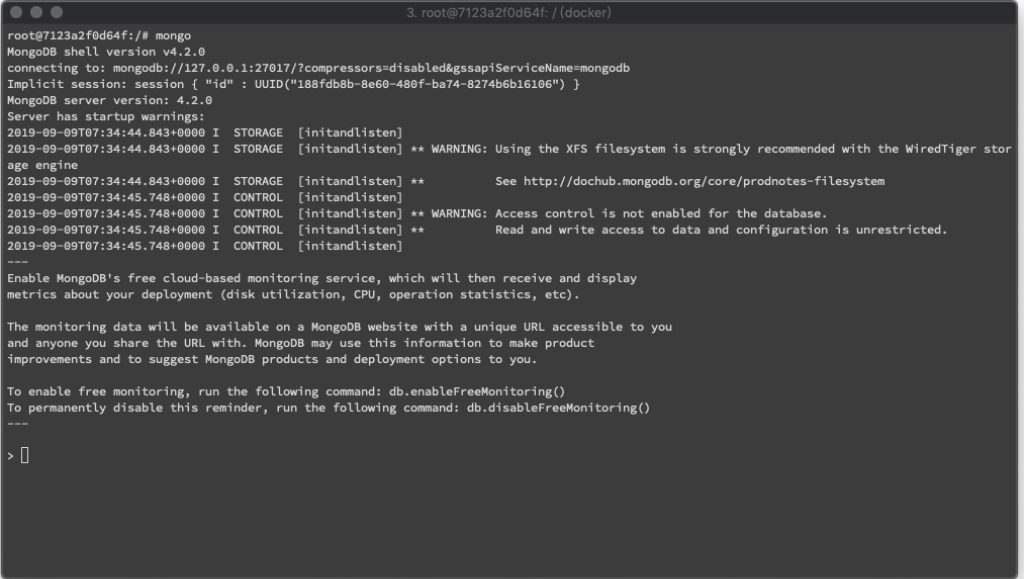
要設定或啟用 MongoDB Profiler 功能去能監控較慢的運行,可先進入 MongoDB。
mongo
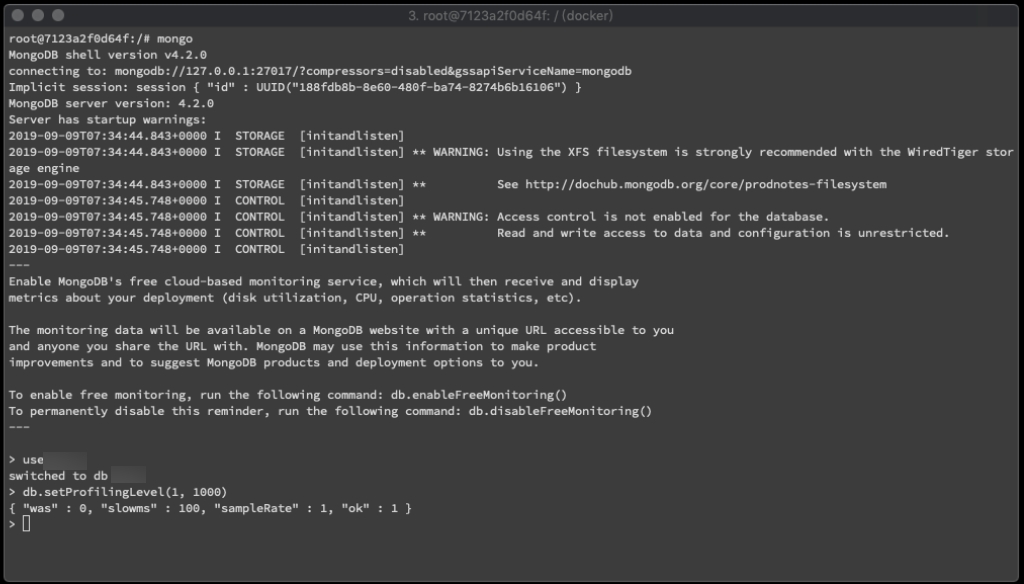
切到指定資料庫。
use $db
透過 db.setProfilingLevel 設定 Profiling 的層級與定義耗費多少毫秒是慢的處理。
db.setProfilingLevel($level, $slowms)
Profiling 的層級如下:
| Level | Description |
|---|---|
| 0 | The profiler is off and does not collect any data. This is the default profiler level. |
| 1 | The profiler collects data for operations that take longer than the value of slowms. |
| 2 | The profiler collects data for all operations. |
如果層級設為 0,則會停止 Profiling;設為 1,則會抓取比 slowms 久的操作;設為 2,則會抓取所有操作。
設定完實際運行程式,MongoDB Profiler 就會依 Profiling 的設定幫我們抓出慢的操作。
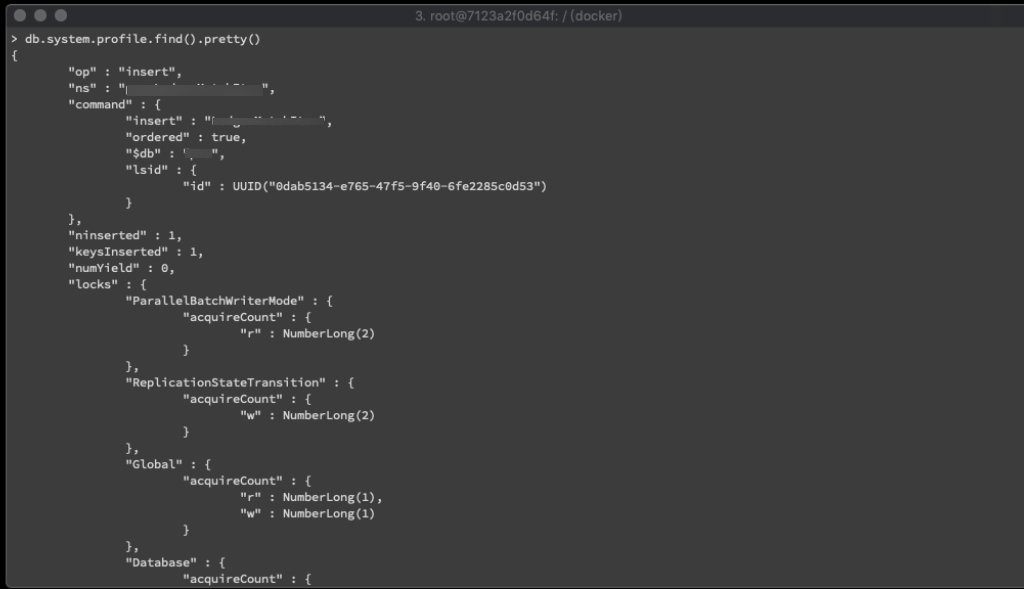
Profiler 抓出的資料會被放置在 db.system.profile,可對此操作查閱。
db.system.profile.find().pretty()